Same-sex married-couple households share
United StatesAll households
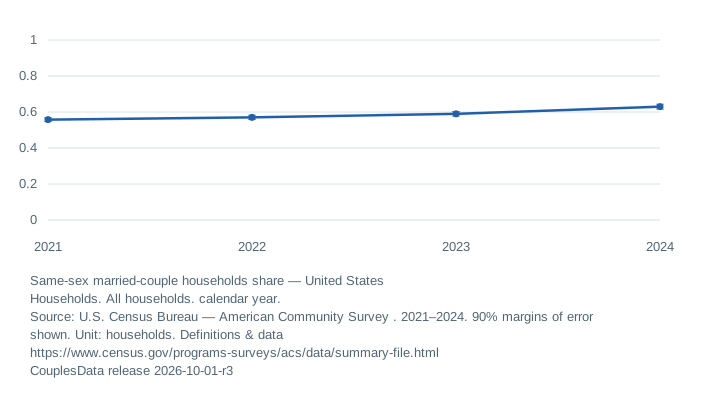
View data table and reporting notes
| Year | Same-sex married-couple households share | Notes |
|---|---|---|
| 2021 | 0.6 ± 0.01 | — |
| 2022 | 0.6 ± 0.01 | — |
| 2023 | 0.6 ± 0.01 | — |
| 2024 | 0.6 ± 0.01 | — |
Household categories are not identity estimates
B11009 classifies the householder and spouse or unmarried partner using their reported sex. It does not measure every LGBTQ relationship or establish sexual orientation or gender identity.
Both displayed shares use all households as the denominator, rather than only married or cohabiting households. The associated dataset and explorer provide each series separately.
Small estimates need their uncertainty
State estimates may be small with sizeable relative margins of error. Comparing point estimates alone can make differences look more certain than the survey supports. These are household estimates, not counts of individual partners.
Explore the evidence
Relationship research: populations, places and comparisons
Compare compatible places and years
Inspect the full dataset and source notes
Initial edition, October 1, 2026. Revision history. Numerical answers are generated from release 2026-10-01-r3.