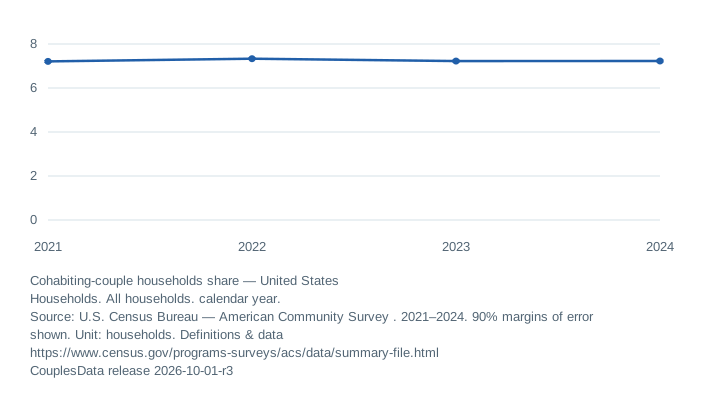
Cohabiting-couple households share
United StatesAll households
View data table and reporting notes
| Year | Cohabiting-couple households share | Notes |
|---|---|---|
| 2021 | 7.2 ± 0.04 | — |
| 2022 | 7.3 ± 0.04 | — |
| 2023 | 7.2 ± 0.05 | — |
| 2024 | 7.2 ± 0.04 | — |
Questions worth separating
- How common are cohabiting-couple households?
Cohabiting and married-couple household shares with a clearly labelled all-household denominator.
- What do surveys show about same-sex couple households?
Source-defined same-sex householder relationships with clear denominators and uncertainty.
Start with the unit and denominator
Legal events, people and households are counted differently. Select a question before comparing a number.
A household is not every relationship
The Census measures here classify the relationship between a householder and their spouse or unmarried partner. A household can contain other relationships that this couple-household measure does not describe, and partners can live in separate homes.
Use the all-household denominator when quoting these percentages. Dividing a cohabiting-household count by the adult population would create a different, unsupported measure. For breakdowns, keep married and cohabiting household categories separate and retain each estimate’s margin of error.
Source: Census ACS B11009, 2024. Calculation inputs and limitations.
Follow the source
Explore versioned datasets, place profiles and the comparable-series explorer. Definitions and source limits accompany the figures.