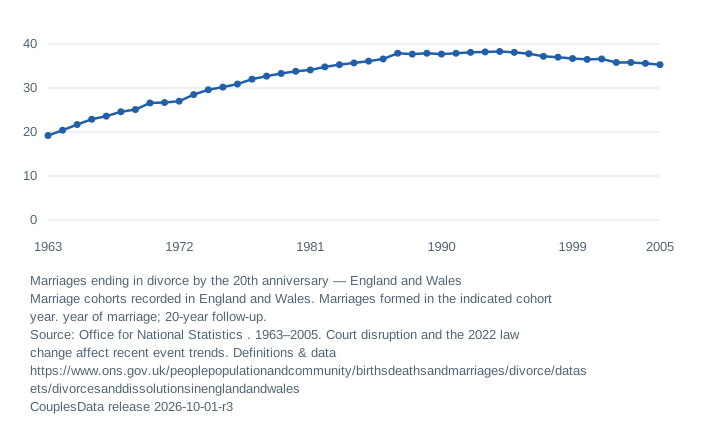
Marriages ending in divorce by the 20th anniversary
England and WalesMarriages formed in the indicated cohort year · Year = marriage cohort
View data table and reporting notes
| Marriage cohort | Marriages ending in divorce by the 20th anniversary | Notes |
|---|---|---|
| 1963 | 19.2 | — |
| 1964 | 20.4 | — |
| 1965 | 21.7 | — |
| 1966 | 22.9 | — |
| 1967 | 23.6 | — |
| 1968 | 24.6 | — |
| 1969 | 25.1 | — |
| 1970 | 26.6 | — |
| 1971 | 26.7 | — |
| 1972 | 27.0 | — |
| 1973 | 28.5 | — |
| 1974 | 29.6 | — |
| 1975 | 30.2 | — |
| 1976 | 30.9 | — |
| 1977 | 32.0 | — |
| 1978 | 32.7 | — |
| 1979 | 33.3 | — |
| 1980 | 33.8 | — |
| 1981 | 34.1 | — |
| 1982 | 34.8 | — |
| 1983 | 35.3 | — |
| 1984 | 35.7 | — |
| 1985 | 36.1 | — |
| 1986 | 36.6 | — |
| 1987 | 37.9 | — |
| 1988 | 37.7 | — |
| 1989 | 37.9 | — |
| 1990 | 37.7 | — |
| 1991 | 37.9 | — |
| 1992 | 38.1 | — |
| 1993 | 38.2 | — |
| 1994 | 38.3 | — |
| 1995 | 38.1 | — |
| 1996 | 37.8 | — |
| 1997 | 37.2 | — |
| 1998 | 37.0 | — |
| 1999 | 36.7 | — |
| 2000 | 36.5 | — |
| 2001 | 36.6 | — |
| 2002 | 35.8 | — |
| 2003 | 35.8 | — |
| 2004 | 35.6 | — |
| 2005 | 35.3 | — |
Follow the same marriage cohort
A cohort groups marriages formed in the same period and follows their outcomes to a stated anniversary. The chart compares marriage cohorts at the same 20-year follow-up horizon. Annual marriages and annual divorces do not follow the same couples.
The ONS workbook uses marriage formation data through 2023 and divorce data through 2025. Recent cohorts without 20 years of follow-up are not shown; their eventual outcomes remain unobserved.
Read the assumptions alongside the estimate
ONS assumes couples divorcing in England and Wales also married there, and that marriages formed there also divorce there. Cross-border marriages and divorces can violate these assumptions. The tables do not take account of marriages ending through a partner’s death.
Civil partnerships converted to marriage enter the divorce figures differently from the marriage totals. The official workbook explains how this can affect the percentages. This descriptive series is not a personal risk calculator.
Explore the evidence
Relationship research: populations, places and comparisons
Compare compatible places and years
Inspect the full dataset and source notes
Initial edition, October 1, 2026. Revision history. Numerical answers are generated from release 2026-10-01-r3.