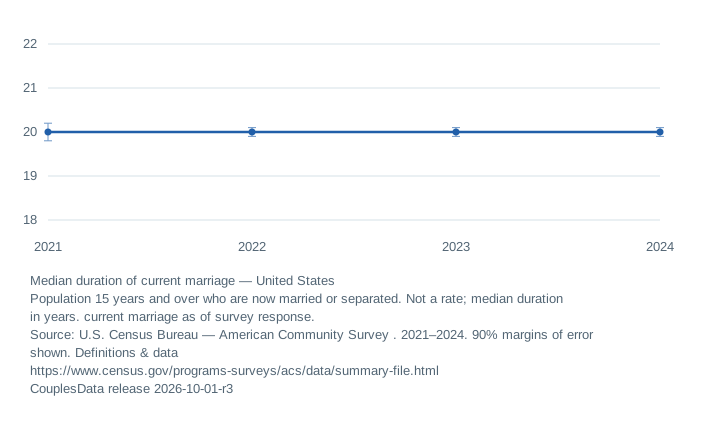
Median duration of current marriage
United StatesDuration in years; ACS 1-year estimates
View data table and reporting notes
| Year | Median duration of current marriage | Notes |
|---|---|---|
| 2021 | 20.0 ± 0.20 | — |
| 2022 | 20.0 ± 0.10 | — |
| 2023 | 20.0 ± 0.10 | — |
| 2024 | 20.0 ± 0.10 | — |
The marriages still in the snapshot
ACS B12504 describes a current marriage among people who are now married or separated. Marriages that already ended are not part of this current-marriage population.
Long-lasting marriages have had more opportunity to remain in the snapshot. This is why the measure cannot answer how long a new marriage will last or the average time before divorce.
Use the published median
The national value is imported directly from the source. It is not an average of state medians or of the male and female medians. Source 90% margins of error accompany the estimate.
Explore the evidence
Relationship research: populations, places and comparisons
Compare compatible places and years
Inspect the full dataset and source notes
Initial edition, October 1, 2026. Revision history. Numerical answers are generated from release 2026-10-01-r3.