Crude marriage rate
United States1,000 residents in the reporting area
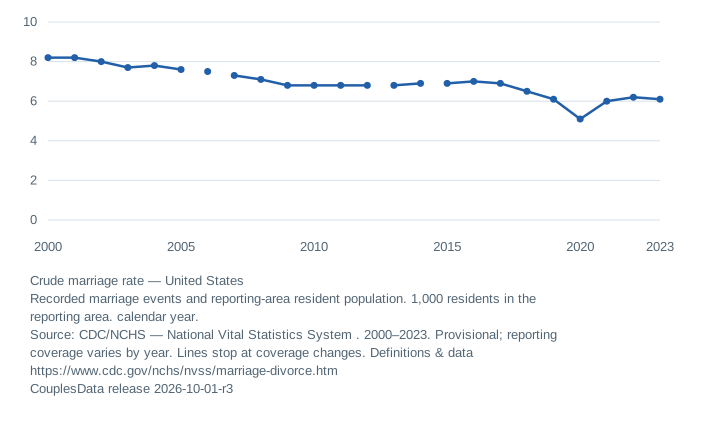
View data table and reporting notes
| Year | Crude marriage rate | Notes |
|---|---|---|
| 2000 | 8.2 | Provisional · 51 reporting areas |
| 2001 | 8.2 | Provisional; Revised rate using intercensal population estimates · 51 reporting areas |
| 2002 | 8.0 | Provisional; Revised rate using intercensal population estimates · 51 reporting areas |
| 2003 | 7.7 | Provisional; Revised rate using intercensal population estimates · 51 reporting areas |
| 2004 | 7.8 | Provisional; Revised rate using intercensal population estimates · 51 reporting areas |
| 2005 | 7.6 | Provisional; Revised rate using intercensal population estimates · 51 reporting areas |
| 2006 | 7.5 | Provisional; Revised rate using intercensal population estimates; Excluded: Louisiana · 50 reporting areas |
| 2007 | 7.3 | Provisional; Revised rate using intercensal population estimates · 51 reporting areas |
| 2008 | 7.1 | Provisional; Revised rate using intercensal population estimates · 51 reporting areas |
| 2009 | 6.8 | Provisional; Revised rate using intercensal population estimates · 51 reporting areas |
| 2010 | 6.8 | Provisional · 51 reporting areas |
| 2011 | 6.8 | Provisional · 51 reporting areas |
| 2012 | 6.8 | Provisional · 51 reporting areas |
| 2013 | 6.8 | Provisional; Excluded: Georgia · 50 reporting areas |
| 2014 | 6.9 | Provisional; Excluded: Georgia · 50 reporting areas |
| 2015 | 6.9 | Provisional · 51 reporting areas |
| 2016 | 7.0 | Provisional · 51 reporting areas |
| 2017 | 6.9 | Provisional · 51 reporting areas |
| 2018 | 6.5 | Provisional · 51 reporting areas |
| 2019 | 6.1 | Provisional · 51 reporting areas |
| 2020 | 5.1 | Provisional · 51 reporting areas |
| 2021 | 6.0 | Provisional · 51 reporting areas |
| 2022 | 6.2 | Provisional · 51 reporting areas |
| 2023 | 6.1 | Provisional · 51 reporting areas |
What this rate measures
The numerator is recorded marriages and the denominator is the population living in the reporting area. Weddings involving visitors can raise an occurrence-based state rate. Nevada and Hawaii should not be read as rankings of residents’ propensity to marry.
The national reporting area changes in some years: Georgia is excluded in 2013 and 2014, and Louisiana in 2006. The table retains those exclusions.
Compare a consistent measure
Use the same source and reference year for state comparisons. A marriage event is not a married person, and a current married share is a different measure. No couples counts are fabricated by dividing survey estimates by two.
Explore the evidence
Relationship research: populations, places and comparisons
Compare compatible places and years
Inspect the full dataset and source notes
Initial edition, October 1, 2026. Revision history. Numerical answers are generated from release 2026-10-01-r3.