Married in the past 12 months (people)
United StatesResidents aged 15 and over
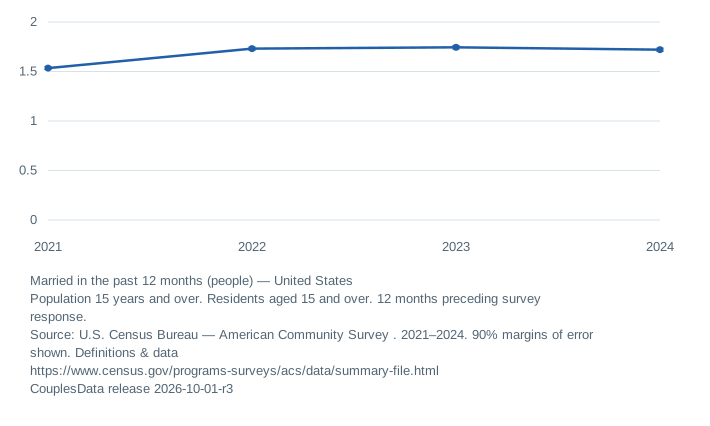
View data table and reporting notes
| Year | Married in the past 12 months (people) | Notes |
|---|---|---|
| 2021 | 1.5 ± 0.01 | — |
| 2022 | 1.7 ± 0.02 | — |
| 2023 | 1.7 ± 0.02 | — |
| 2024 | 1.7 ± 0.02 | — |
A rolling lookback, not a calendar-year count
Responses are collected throughout the year. Each person reports on their own preceding 12 months, so this measure does not describe exactly January through December 2024.
The numerator sums the male and female married-last-year cells in B12501. The denominator is all residents aged 15 and over, including never-married people.
Why not divide the estimate by two?
Partners can live in different geographic areas, have different survey inclusion or reporting patterns, or fall outside the defined population. Dividing these people by two would invent an unsupported couple or event count. Use administrative marriage records for recorded wedding events.
Explore the evidence
Relationship research: populations, places and comparisons
Compare compatible places and years
Inspect the full dataset and source notes
Initial edition, October 1, 2026. Revision history. Numerical answers are generated from release 2026-10-01-r3.