Includes annulments and, in some jurisdictions, petitions or separations. Missing states are not zeros. This is not lifetime divorce probability.
Measure definition and provenance Unit, denominator, population and source terms
Crude divorce rate
United States1,000 residents in the reporting area
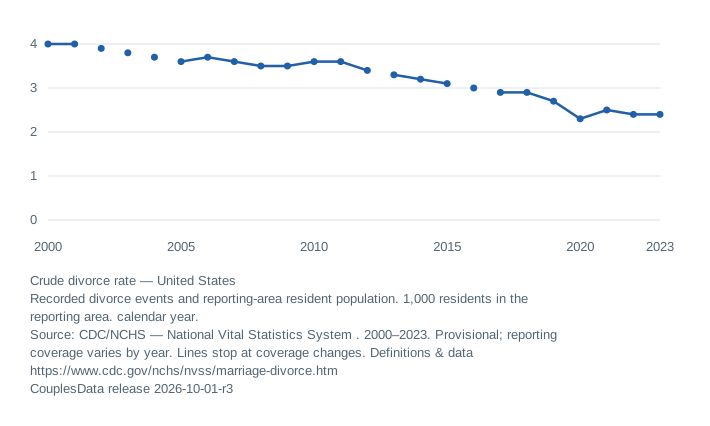
View data table and reporting notes
| Year | Crude divorce rate | Notes |
|---|---|---|
| 2000 | 4.0 | Provisional; Excluded: California, Indiana, Louisiana, Oklahoma · 47 reporting areas |
| 2001 | 4.0 | Provisional; Revised rate using intercensal population estimates; Excluded: California, Indiana, Louisiana, Oklahoma · 47 reporting areas |
| 2002 | 3.9 | Provisional; Revised rate using intercensal population estimates; Excluded: California, Indiana, Oklahoma · 48 reporting areas |
| 2003 | 3.8 | Provisional; Revised rate using intercensal population estimates; Excluded: California, Hawaii, Indiana, Oklahoma · 47 reporting areas |
| 2004 | 3.7 | Provisional; Revised rate using intercensal population estimates; Excluded: California, Georgia, Hawaii, Indiana, Louisiana · 46 reporting areas |
| 2005 | 3.6 | Provisional; Revised rate using intercensal population estimates; Excluded: California, Georgia, Hawaii, Indiana, Louisiana, Minnesota · 45 reporting areas |
| 2006 | 3.7 | Provisional; Revised rate using intercensal population estimates; Excluded: California, Georgia, Hawaii, Indiana, Louisiana, Minnesota · 45 reporting areas |
| 2007 | 3.6 | Provisional; Revised rate using intercensal population estimates; Excluded: California, Georgia, Hawaii, Indiana, Louisiana, Minnesota · 45 reporting areas |
| 2008 | 3.5 | Provisional; Revised rate using intercensal population estimates; Excluded: California, Georgia, Hawaii, Indiana, Louisiana, Minnesota · 45 reporting areas |
| 2009 | 3.5 | Provisional; Revised rate using intercensal population estimates; Excluded: California, Georgia, Hawaii, Indiana, Louisiana, Minnesota · 45 reporting areas |
| 2010 | 3.6 | Provisional; Excluded: California, Georgia, Hawaii, Indiana, Louisiana, Minnesota · 45 reporting areas |
| 2011 | 3.6 | Provisional; Excluded: California, Georgia, Hawaii, Indiana, Louisiana, Minnesota · 45 reporting areas |
| 2012 | 3.4 | Provisional; Excluded: California, Georgia, Hawaii, Indiana, Louisiana, Minnesota · 45 reporting areas |
| 2013 | 3.3 | Provisional; Excluded: California, Georgia, Hawaii, Indiana, Minnesota · 46 reporting areas |
| 2014 | 3.2 | Provisional; Excluded: California, Georgia, Hawaii, Indiana, Minnesota · 46 reporting areas |
| 2015 | 3.1 | Provisional; Excluded: California, Georgia, Hawaii, Indiana, Minnesota · 46 reporting areas |
| 2016 | 3.0 | Provisional; National count and rate revised for Illinois and Texas; Excluded: California, Georgia, Hawaii, Indiana, Minnesota, New Mexico · 45 reporting areas |
| 2017 | 2.9 | Provisional; Excluded: California, Hawaii, Indiana, Minnesota, New Mexico · 46 reporting areas |
| 2018 | 2.9 | Provisional; Excluded: California, Hawaii, Indiana, Minnesota, New Mexico · 46 reporting areas |
| 2019 | 2.7 | Provisional; Excluded: California, Hawaii, Indiana, Minnesota, New Mexico · 46 reporting areas |
| 2020 | 2.3 | Provisional; Excluded: California, Hawaii, Indiana, Minnesota, New Mexico · 46 reporting areas |
| 2021 | 2.5 | Provisional; National count revised for Maryland; total rate unchanged; Excluded: California, Hawaii, Indiana, Minnesota, New Mexico · 46 reporting areas |
| 2022 | 2.4 | Provisional; Excluded: California, Hawaii, Indiana, Minnesota, New Mexico · 46 reporting areas |
| 2023 | 2.4 | Provisional; Excluded: California, Hawaii, Indiana, Minnesota, New Mexico · 46 reporting areas |
Download this release
1,248 observations, including explicitly missing records. CSV retains scope and attribution; JSON includes calculation inputs and flags.
Source: CDC/NCHS, National Vital Statistics System. Original data available free from CDC. Use does not imply CDC, HHS or U.S. Government endorsement.
Original table footnotes Revisions and the population reference dates
[Rates are based on provisional counts of divorces by state of occurrence. Rates are per 1,000 total population residing in area. Population enumerated as of April 1 for 1990, 2000, and 2010 and estimated as of July 1 for all
other years]
Note: Rate for 2021 for Maryland has been revised. Rate for 2016 for Texas has been revised. Rates for 2001-2009 have been revised and are based on intercensal population estimates from the 2000 and 2010 censuses.
Source: CDC/NCHS, National Vital Statistics System.
--- Data not available.
Includes annulments. Includes divorce petitions filed or legal separations for some counties or States.
CDC/NCHS source tables. State rate availability does not always match the national table's reporting-area definition. Oklahoma has no state marriage rate in this table for 2000–2003, although the national reporting-area definition includes it.
Interpretation and revisions
Includes annulments and, in some jurisdictions, petitions or separations. Missing states are not zeros. This is not lifetime divorce probability.
National coverage is stored on every observation. Changes in reporting geography prevent treating the national history as a constant-area panel. Original table footnotes are retained.
Initial publication: October 1, 2026. Corrections log. Review was assisted by automation and is not an independent expert review.