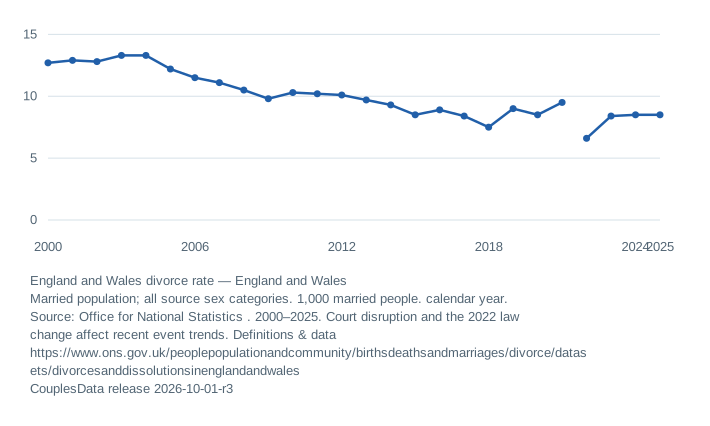
This is not a crude rate per 1,000 total residents. Reliability indicators relate to the estimated married-population denominator. Court disruption and the 2022 law change affect timing.
Measure definition and provenance Unit, denominator, population and source terms
England and Wales divorce rate
England and Wales1,000 married people
View data table and reporting notes
| Year | England and Wales divorce rate | Notes |
|---|---|---|
| 2000 | 12.7 | [x] |
| 2001 | 12.9 | [x] |
| 2002 | 12.8 | a |
| 2003 | 13.3 | a |
| 2004 | 13.3 | a |
| 2005 | 12.2 | a |
| 2006 | 11.5 | a |
| 2007 | 11.1 | a |
| 2008 | 10.5 | a |
| 2009 | 9.8 | a |
| 2010 | 10.3 | a |
| 2011 | 10.2 | a |
| 2012 | 10.1 | a |
| 2013 | 9.7 | a |
| 2014 | 9.3 | a |
| 2015 | 8.5 | a |
| 2016 | 8.9 | a |
| 2017 | 8.4 | a |
| 2018 | 7.5 | a |
| 2019 | 9.0 | a |
| 2020 | 8.5 | a |
| 2021 | 9.5 | a |
| 2022 | 6.6 | a; 2022 legislation affects timing |
| 2023 | 8.4 | a; 2022 legislation affects timing |
| 2024 | 8.5 | a; 2022 legislation affects timing |
| 2025 | 8.5 | a; 2022 legislation affects timing |
Download this release
26 observations, including explicitly missing records. CSV retains scope and attribution; JSON includes calculation inputs and flags.
Source: Office for National Statistics licensed under the Open Government Licence v3.0. Contains public sector information licensed under the OGL v3.0.
Interpretation and revisions
This is not a crude rate per 1,000 total residents. Reliability indicators relate to the estimated married-population denominator. Court disruption and the 2022 law change affect timing.
Workbook notes identify changes in law, court activity and cohort assumptions. Source rate reliability flag a means precise; it does not imply absence of all error.
Initial publication: October 1, 2026. Corrections log. Review was assisted by automation and is not an independent expert review.