Source: U.S. Census Bureau, ACS one-year B12001, 2024. The estimated population aged 15+ is 5,129,814; percentages are CouplesData calculations. See all five categories, counts and 90% margins of error.
Residents: first-marriage timing
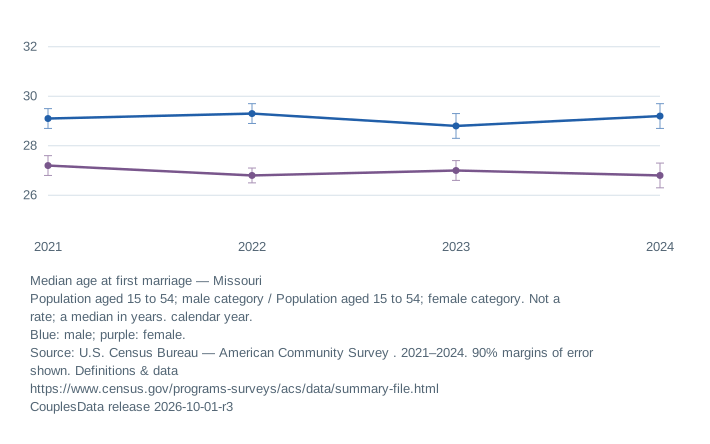
Estimates describe the resident population. Whiskers are 90% margins of error; they are not a statement about an individual.
Median age at first marriage
MissouriAge in years; ACS 1-year estimates
View data table and reporting notes
| Year | Median age at first marriage (male) | Median age at first marriage (female) | Notes |
|---|---|---|---|
| 2021 | 29.1 ± 0.40 | 27.2 ± 0.40 | — |
| 2022 | 29.3 ± 0.40 | 26.8 ± 0.30 | — |
| 2023 | 28.8 ± 0.50 | 27.0 ± 0.40 | — |
| 2024 | 29.2 ± 0.50 | 26.8 ± 0.50 | — |
Current marital status Who is married, divorced or never married?
| Measure | Share | 90% MOE | Definition |
|---|---|---|---|
| Currently married, including separated share | 50.4% | ± 0.40 pp | The B12001 now-married category includes separated people. This is not a measure of couples living together. |
| Currently divorced share | 11.6% | ± 0.23 pp | This is current status, not the percentage who have ever divorced. Remarriage, migration and mortality affect it. |
| Never married share | 32.0% | ± 0.30 pp | Never married does not mean unpartnered, seeking a partner or available to date. |
Source: U.S. Census Bureau, ACS B12001, 2024. These categories do not describe whether someone is dating.
Marital status, with the population in view
Five mutually exclusive legal-status categories describe residents aged 15 and over. Here, married excludes separated people so the five categories do not overlap. They do not establish whether someone has a romantic partner or is seeking one.
Current marital status in Missouri
2024 · Residents aged 15 and over · Census ACS one-year
Source: U.S. Census Bureau, ACS B12001. Shares calculated by CouplesData from the same population and period. 90% margins of error are in the table below. Inspect source.
Show counts, shares and uncertainty
| Current status | People | Count ±90% MOE | Share | Share ±90% MOE |
|---|---|---|---|---|
| Never married | 1,641,523 | 15,502 | 32.0% | 0.30 pp |
| Married, except separated | 2,515,057 | 21,937 | 49.0% | 0.43 pp |
| Separated | 72,320 | 4,642 | 1.4% | 0.09 pp |
| Widowed | 308,155 | 7,915 | 6.0% | 0.15 pp |
| Currently divorced | 592,759 | 11,981 | 11.6% | 0.23 pp |
Break down by sex
The source reports male and female categories. Each percentage uses the matching sex-specific population aged 15+. These categories are not a measure of gender identity or sexual orientation.
Male residents aged 15+
2024 · Male residents aged 15 and over · Census ACS one-year
Source: U.S. Census Bureau, ACS B12001. Shares calculated by CouplesData from the same population and period. 90% margins of error are in the table below. Inspect source.
Show counts, shares and uncertainty
| Current status | People | Count ±90% MOE | Share | Share ±90% MOE |
|---|---|---|---|---|
| Never married | 876,236 | 10,479 | 35.0% | 0.41 pp |
| Married, except separated | 1,275,355 | 15,045 | 50.9% | 0.59 pp |
| Separated | 29,874 | 2,806 | 1.2% | 0.11 pp |
| Widowed | 70,155 | 3,614 | 2.8% | 0.14 pp |
| Currently divorced | 252,480 | 7,225 | 10.1% | 0.29 pp |
Female residents aged 15+
2024 · Female residents aged 15 and over · Census ACS one-year
Source: U.S. Census Bureau, ACS B12001. Shares calculated by CouplesData from the same population and period. 90% margins of error are in the table below. Inspect source.
Show counts, shares and uncertainty
| Current status | People | Count ±90% MOE | Share | Share ±90% MOE |
|---|---|---|---|---|
| Never married | 765,287 | 11,424 | 29.1% | 0.43 pp |
| Married, except separated | 1,239,702 | 15,964 | 47.2% | 0.60 pp |
| Separated | 42,446 | 3,698 | 1.6% | 0.14 pp |
| Widowed | 238,000 | 7,042 | 9.1% | 0.27 pp |
| Currently divorced | 340,279 | 9,557 | 13.0% | 0.36 pp |
See the one-year trend
Currently divorced share among residents aged 15 and over. This is a changing population snapshot, not annual divorce incidence or the outcome of a marriage cohort.
Currently divorced share over time
Source: U.S. Census Bureau, ACS one-year B12001. 2021–2024; residents aged 15+. Shares and approximate 90% MOEs calculated by CouplesData. Annual population snapshots, not a followed marriage cohort.
| Year | Currently divorced people | Population aged 15+ | Divorced share | MOE |
|---|---|---|---|---|
| 2021 | 593,599 | 5,026,699 | 11.8% | ±0.27 pp |
| 2022 | 603,154 | 5,058,244 | 11.9% | ±0.25 pp |
| 2023 | 593,181 | 5,076,786 | 11.7% | ±0.24 pp |
| 2024 | 592,759 | 5,129,814 | 11.6% | ±0.23 pp |
Source: Census ACS B12001, 2021–2024. Share and MOE calculated by CouplesData.
Explore the separate Data Commons five-year series
These estimates cover five-year periods. They use a different product from the one-year figures above and must not be combined in a ranking. Adjacent periods overlap. The table below selects non-overlapping periods, working back five years at a time from the latest estimate. Each row describes a different five-year window. All rolling periods remain in the download.
Five-year marital-status snapshot
2020–2024 · Residents aged 15 and over · Data Commons · Census ACS five-year
Source: U.S. Census Bureau, ACS B12001 via Data Commons. Shares calculated by CouplesData from the same population and period. Margins of error are unavailable in this Data Commons facet. Inspect source.
Show counts, shares and uncertainty
| Current status | People | Count ±90% MOE | Share | Share ±90% MOE |
|---|---|---|---|---|
| Never married | 1,604,002 | Unavailable | 31.7% | Unavailable |
| Married, except separated | 2,459,190 | Unavailable | 48.6% | Unavailable |
| Separated | 79,723 | Unavailable | 1.6% | Unavailable |
| Widowed | 308,336 | Unavailable | 6.1% | Unavailable |
| Currently divorced | 605,300 | Unavailable | 12.0% | Unavailable |
| Reference period | People | Share |
|---|---|---|
| 2010–2014 | 587,140 | 12.1% |
| 2015–2019 | 603,774 | 12.2% |
| 2020–2024 | 605,300 | 12.0% |
Source: Data Commons, Census ACS five-year. Facet 10169881228856630405. Coverage and verification.
Households and living together Cohabitation, marriage and source-defined same-sex households
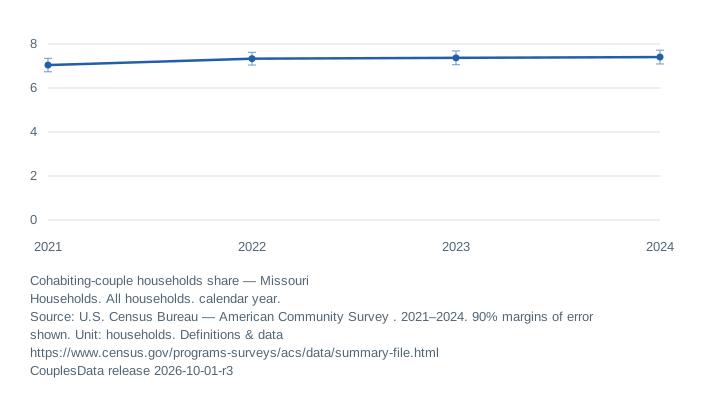
Cohabiting-couple households share
MissouriAll households
View data table and reporting notes
| Year | Cohabiting-couple households share | Notes |
|---|---|---|
| 2021 | 7.0 ± 0.31 | — |
| 2022 | 7.3 ± 0.29 | — |
| 2023 | 7.4 ± 0.31 | — |
| 2024 | 7.4 ± 0.31 | — |
Householder-partner relationships do not capture every romantic relationship within or outside a household. These are households, not people. The denominator includes households without a couple.
- Married-couple households share: 46.5% of all households (2024)
- Same-sex married-couple households share: 0.5% of all households (2024)
- Same-sex cohabiting-couple households share: 0.5% of all households (2024)
Source: ACS B11009, 2024. Each linked dataset includes MOEs and definitions.
Recorded legal events Marriage and divorce rates, with reporting gaps
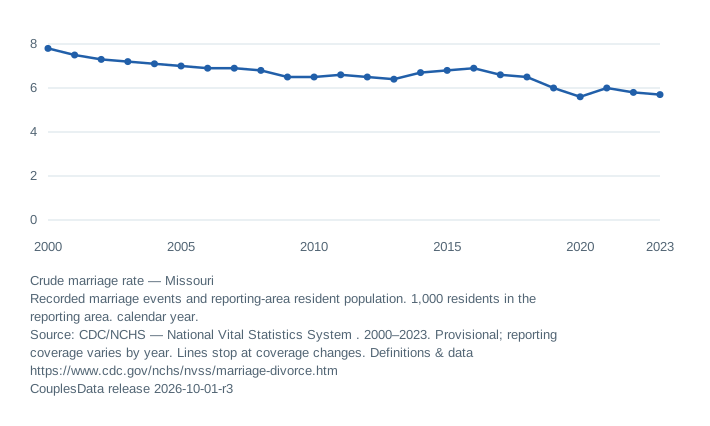
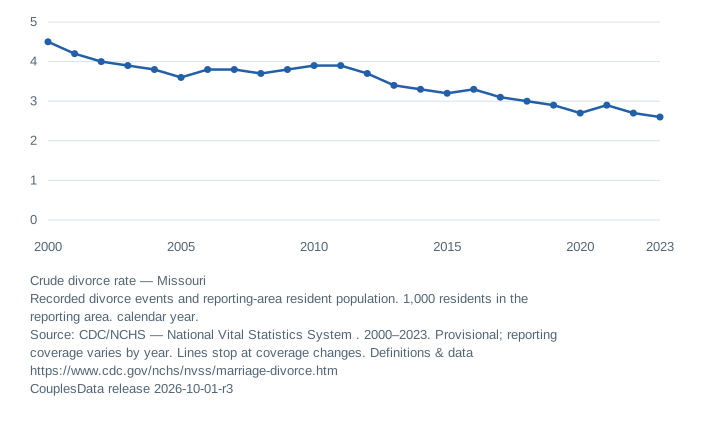
These rates count events where they occurred and use resident population as the denominator. They are separate from the resident survey measures above.
Crude marriage rate
Missouri1,000 residents in the reporting area
View data table and reporting notes
| Year | Crude marriage rate | Notes |
|---|---|---|
| 2000 | 7.8 | Provisional |
| 2001 | 7.5 | Provisional; Revised rate using intercensal population estimates |
| 2002 | 7.3 | Provisional; Revised rate using intercensal population estimates |
| 2003 | 7.2 | Provisional; Revised rate using intercensal population estimates |
| 2004 | 7.1 | Provisional; Revised rate using intercensal population estimates |
| 2005 | 7.0 | Provisional; Revised rate using intercensal population estimates |
| 2006 | 6.9 | Provisional; Revised rate using intercensal population estimates |
| 2007 | 6.9 | Provisional; Revised rate using intercensal population estimates |
| 2008 | 6.8 | Provisional; Revised rate using intercensal population estimates |
| 2009 | 6.5 | Provisional; Revised rate using intercensal population estimates |
| 2010 | 6.5 | Provisional |
| 2011 | 6.6 | Provisional |
| 2012 | 6.5 | Provisional |
| 2013 | 6.4 | Provisional |
| 2014 | 6.7 | Provisional |
| 2015 | 6.8 | Provisional; State rate revised in the source table |
| 2016 | 6.9 | Provisional |
| 2017 | 6.6 | Provisional |
| 2018 | 6.5 | Provisional |
| 2019 | 6.0 | Provisional |
| 2020 | 5.6 | Provisional |
| 2021 | 6.0 | Provisional |
| 2022 | 5.8 | Provisional |
| 2023 | 5.7 | Provisional |
Crude divorce rate
Missouri1,000 residents in the reporting area
View data table and reporting notes
| Year | Crude divorce rate | Notes |
|---|---|---|
| 2000 | 4.5 | Provisional |
| 2001 | 4.2 | Provisional; Revised rate using intercensal population estimates |
| 2002 | 4.0 | Provisional; Revised rate using intercensal population estimates |
| 2003 | 3.9 | Provisional; Revised rate using intercensal population estimates |
| 2004 | 3.8 | Provisional; Revised rate using intercensal population estimates |
| 2005 | 3.6 | Provisional; Revised rate using intercensal population estimates |
| 2006 | 3.8 | Provisional; Revised rate using intercensal population estimates |
| 2007 | 3.8 | Provisional; Revised rate using intercensal population estimates |
| 2008 | 3.7 | Provisional; Revised rate using intercensal population estimates |
| 2009 | 3.8 | Provisional; Revised rate using intercensal population estimates |
| 2010 | 3.9 | Provisional |
| 2011 | 3.9 | Provisional |
| 2012 | 3.7 | Provisional |
| 2013 | 3.4 | Provisional |
| 2014 | 3.3 | Provisional |
| 2015 | 3.2 | Provisional |
| 2016 | 3.3 | Provisional |
| 2017 | 3.1 | Provisional |
| 2018 | 3.0 | Provisional |
| 2019 | 2.9 | Provisional |
| 2020 | 2.7 | Provisional |
| 2021 | 2.9 | Provisional |
| 2022 | 2.7 | Provisional |
| 2023 | 2.6 | Provisional |
Includes annulments and, in some jurisdictions, petitions or separations. Missing states are not zeros. This is not lifetime divorce probability.
Recent experiences and marriage duration Resident survey measures; separate from legal event counts
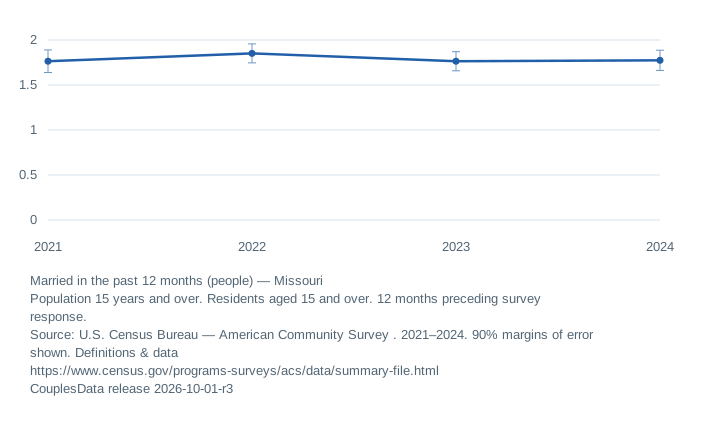
Counts people reporting an experience, not legal events or couples. The rolling lookback is not a calendar-year event count. Do not divide by two or compare directly with administrative rates.
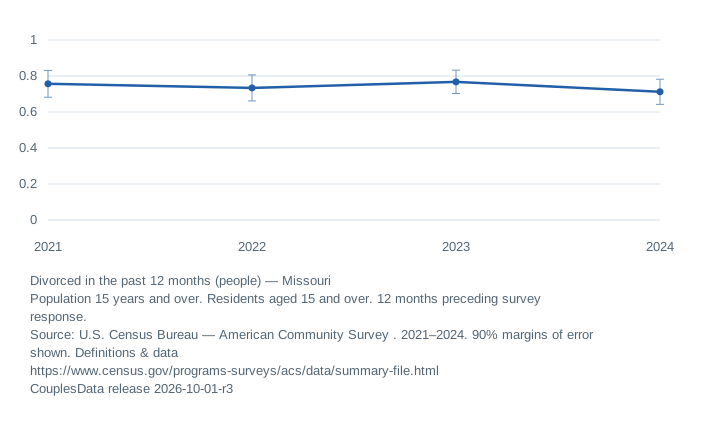
Counts people reporting an experience, not legal events or couples. The rolling lookback is not a calendar-year event count. Do not divide by two or compare directly with administrative rates.
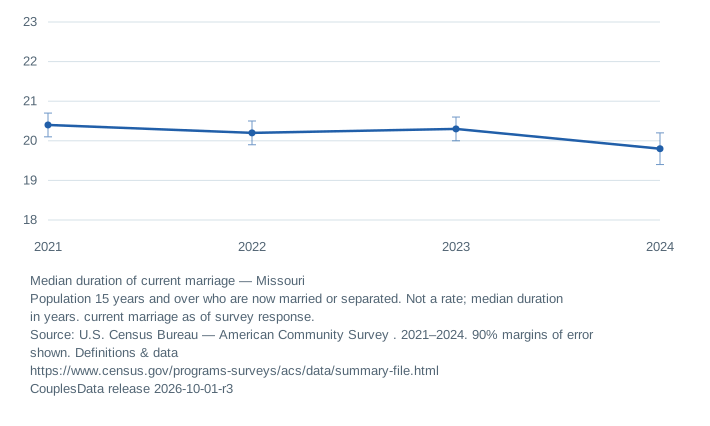
Median duration of current marriage
MissouriDuration in years; ACS 1-year estimates
View data table and reporting notes
| Year | Median duration of current marriage | Notes |
|---|---|---|
| 2021 | 20.4 ± 0.30 | — |
| 2022 | 20.2 ± 0.30 | — |
| 2023 | 20.3 ± 0.30 | — |
| 2024 | 19.8 ± 0.40 | — |
This is a cross-sectional measure of ongoing marriages, not the eventual duration of all marriages. Previously dissolved marriages are not included in this current-marriage measure.