Divorces in England and Wales
England and WalesNone; legal events
Download CSVJSON & metadataDownload chart (SVG)
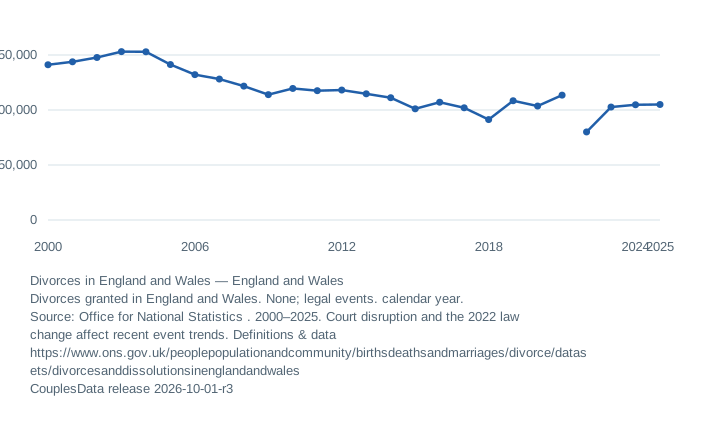
View data table and reporting notes
| Year | Divorces in England and Wales | Notes |
|---|---|---|
| 2000 | 141,135 | — |
| 2001 | 143,818 | — |
| 2002 | 147,735 | — |
| 2003 | 153,065 | — |
| 2004 | 152,923 | — |
| 2005 | 141,322 | — |
| 2006 | 132,140 | — |
| 2007 | 128,131 | — |
| 2008 | 121,708 | — |
| 2009 | 113,949 | — |
| 2010 | 119,589 | — |
| 2011 | 117,558 | — |
| 2012 | 118,140 | — |
| 2013 | 114,720 | — |
| 2014 | 111,169 | — |
| 2015 | 101,077 | — |
| 2016 | 107,071 | — |
| 2017 | 102,007 | — |
| 2018 | 91,299 | — |
| 2019 | 108,421 | — |
| 2020 | 103,592 | — |
| 2021 | 113,505 | — |
| 2022 | 80,057 | 2022 legislation affects timing |
| 2023 | 102,678 | 2022 legislation affects timing |
| 2024 | 104,762 | 2022 legislation affects timing |
| 2025 | 105,002 | 2022 legislation affects timing |
England and Wales divorce rate
England and Wales1,000 married people
Download CSVJSON & metadataDownload chart (SVG)
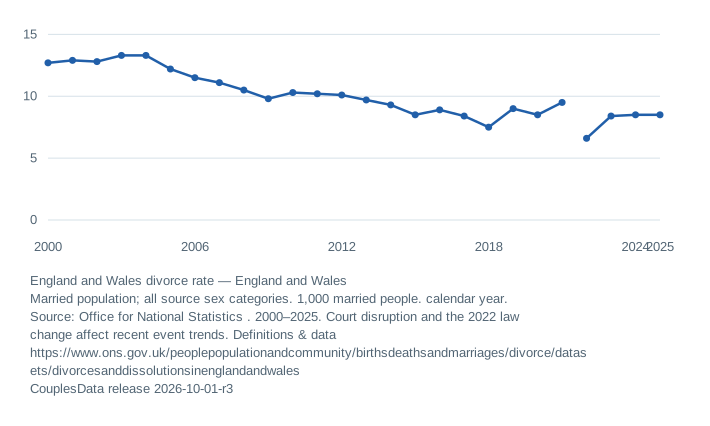
View data table and reporting notes
| Year | England and Wales divorce rate | Notes |
|---|---|---|
| 2000 | 12.7 | [x] |
| 2001 | 12.9 | [x] |
| 2002 | 12.8 | a |
| 2003 | 13.3 | a |
| 2004 | 13.3 | a |
| 2005 | 12.2 | a |
| 2006 | 11.5 | a |
| 2007 | 11.1 | a |
| 2008 | 10.5 | a |
| 2009 | 9.8 | a |
| 2010 | 10.3 | a |
| 2011 | 10.2 | a |
| 2012 | 10.1 | a |
| 2013 | 9.7 | a |
| 2014 | 9.3 | a |
| 2015 | 8.5 | a |
| 2016 | 8.9 | a |
| 2017 | 8.4 | a |
| 2018 | 7.5 | a |
| 2019 | 9.0 | a |
| 2020 | 8.5 | a |
| 2021 | 9.5 | a |
| 2022 | 6.6 | a; 2022 legislation affects timing |
| 2023 | 8.4 | a; 2022 legislation affects timing |
| 2024 | 8.5 | a; 2022 legislation affects timing |
| 2025 | 8.5 | a; 2022 legislation affects timing |
Changes in recording and timing
The 2022 legislation introduced a minimum waiting period and changed divorce procedures. Court disruption during the pandemic also affected when cases completed. Changes in annual counts should not be interpreted as direct changes in relationship stability.
Divorces and civil partnership dissolutions are separate legal events. This profile presents divorce series; the source workbook provides the wider breakdowns.
ONS workbook, notes and methodology